Published by PitchChanger · Updated · How these guides are made
Hear the difference
Original synthetic headroom comparison: three six-second, mono 48 kHz PCM WAV files. A 220 Hz tone appears in bursts of increasing amplitude to model a louder passage; this is not speech and was not recorded through a microphone.
Pause your workspace preview before comparing these clips.
The versions are not loudness-matched. Start at a comfortable low playback level. The second file has deliberately flattened peaks; the third turns that already-clipped signal down without repairing it. No listening-quality or microphone-performance result is claimed.
How to use this workflow
Test the loudest phrase first
Use the microphone and position you intend to keep. Open Voice Recorder, select Start recording and allow microphone access. Say the loud phrase with the same emphasis as the planned take, then Stop and preview it.
Adjust input gain and repeat
Lower the microphone or interface gain, or the system input control that actually affects that device. These controls are outside this page. If necessary, move a little farther from the microphone, keep the new position consistent, and record another test.
Save and check the clean take
Download a useful test before choosing Record again. Record the full take only after the loud section passes. Stop, Download WAV or MP3, and play the saved file to confirm the result before closing the tab.
Avoid clipping while recording a loud voice: test the peaks
A quiet greeting is a poor level check for a take that later includes a shout, laugh or strong sung phrase. Test the strongest planned passage, followed by normal speech, at a repeatable position. Listen to the saved test for distortion on the loud parts and compare it with the quieter part. This is a diagnostic procedure for your setup, not a guarantee that one gain setting suits every microphone.
A decibel meter in an external recording app or interface can make the test more precise. Audacity’s recording guidance suggests leaving maximum peaks around −6 dB as a practical starting point. Unpredictable performances need additional margin; no fixed target prevents every analog overload or unexpectedly loud sound.
Headroom is the space between the signal peak and a chosen ceiling. In the normalized digital model on this page, a peak of 0.5 lies about 6.02 dB below 1.0. That describes amplitude margin, not “half as loud,” a microphone-distance rule or a sound-pressure measurement.
Adjust physical input gain before another take
Reduce the level before the stage that is distorting. Start with the input-gain control on the microphone, audio interface or preamplifier when one is available. A system input slider may control the device or only a later stage, so verify the effect with another loud-phrase test. Voice Recorder does not provide an input-gain slider.
If lowering a software input level makes the waveform smaller but leaves the same distortion, check the earlier microphone or preamp stage. Try a little more distance, or an appropriate hardware pad if your equipment provides one. Change one thing at a time, keep a useful test, and note the setting and position that produced the cleaner result.
Lowering speaker volume changes what you hear; it does not change what was captured. Normalizing or converting a clipped recording also does not recreate the lost original peaks. If the performance is repeatable, fixing the input and making a new take is more reliable than treating a quieter distorted copy as repaired.
Swipe or scroll sideways to read all columns.
| Control or action | Where it acts | What to verify |
|---|---|---|
| Microphone/interface input gain | Before or within capture hardware | The loud test no longer overloads the input. |
| System input level | Depends on the device and driver | A new recording improves, not just its displayed size. |
| Playback volume | After recording, on the listening path | Comfortable monitoring; no claim of repaired capture. |
| More microphone distance | Changes the sound reaching the microphone | Level, tone and room sound still suit the take. |
Original waveform comparison: why turning it down is different
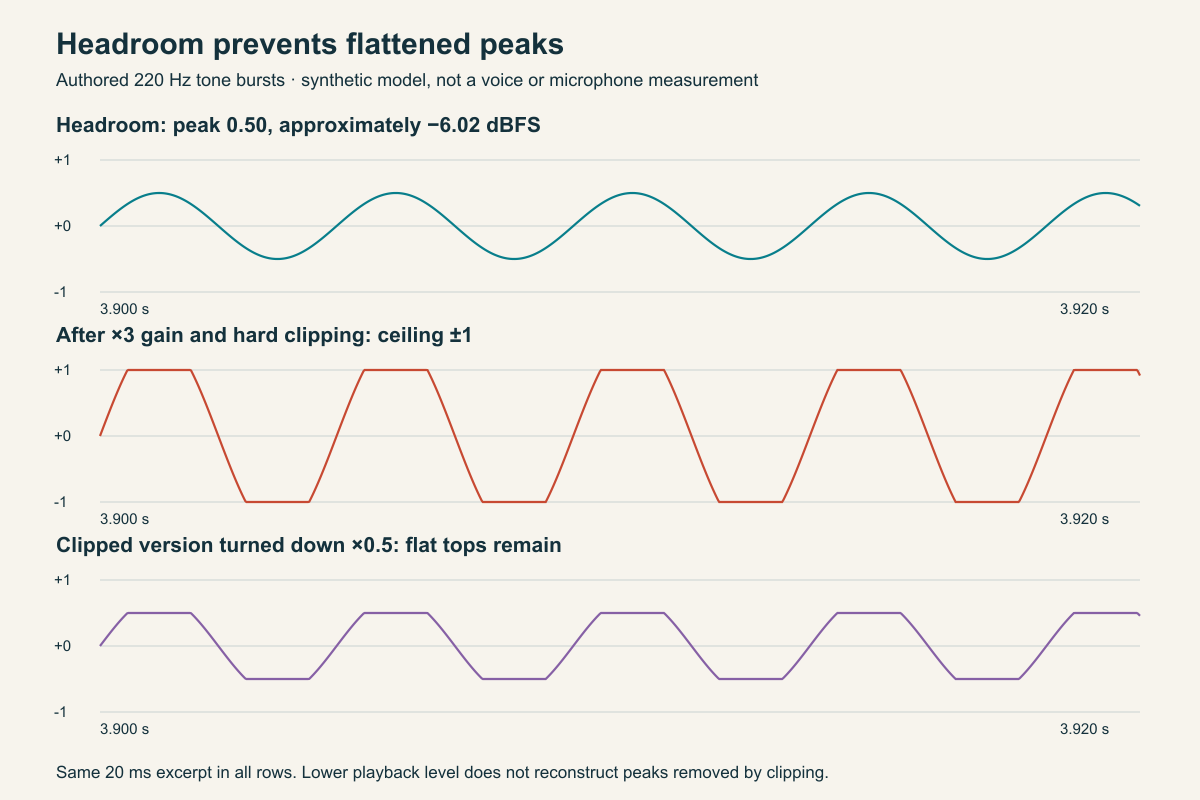
We generated a six-second 220 Hz tone with three amplitude bursts on October 17, 2026. The clean version has an ideal peak amplitude of 0.5. The overloaded version multiplies every sample by 3, then clamps values outside −1 to +1. A third version multiplies that already-clipped result by 0.5. This is a modeled digital-clipping demonstration, not a measurement of a person, microphone, preamp or browser capture.
The gain calculation is 20 × log10(3) = 9.54 dB. A peak starting at 0.5 would become 1.5 without the clamp, exceeding the model’s ceiling. Of the 288,000 source samples, 38,014 exceeded that ceiling. Those peaks become flat, and lowering the finished signal keeps their flattened shape.
All three downloadable WAVs are mono 16-bit PCM at 48,000 Hz and contain 576,044 bytes. The clean and turned-down-clipped files both measure approximately −6.02 dBFS at their highest sample, but their waveforms differ. A low final peak reading therefore does not prove that clipping never happened earlier. The plot shows the same 20 ms excerpt from each modeled signal.
Swipe or scroll sideways to read all columns.
| Version | Operation | Measured exported peak | What the example shows |
|---|---|---|---|
| Headroom preserved | Original model, peak 0.5 | −6.02 dBFS | No samples were clipped in this model. |
| Overloaded | Gain ×3, clamp to ±1 | Approximately 0 dBFS | Peaks reach the imposed ceiling. |
| Clipped, then quieter | Clipped signal ×0.5 | −6.02 dBFS | Flat tops remain below the final ceiling. |
What the recorder’s meter and waveform can tell you
The current Input level bar shows a short-window RMS value with a display maximum of 0.2. It is not a calibrated dBFS peak meter or a clipping indicator. A full bar does not by itself prove clipping, and a bar below full scale does not rule out brief peak overload. These details were checked in the current Recorder component and capture code.
The live waveform summarizes recent peaks, while the completed waveform summarizes the full take. It is useful for seeing activity and broad level changes, but it is not a sample-level editor. Inspect a downloaded WAV in an external audio editor when you need exact peaks or a close-up of suspected flattening.
The capture request asks for mono audio with automatic gain control, echo cancellation and noise suppression disabled. Browser and device behavior still need checking on your hardware. We did not run a physical microphone, room, mobile-device or Safari recording test for this article.
Finish the test, then record and save the full take
Use Stop to finalize the test and preview it. Save any version you want to keep before choosing Record again. Repeat the loud and normal phrases after changing gain, then make the intended take using the same setup. Download WAV for a PCM working copy, or use the available MP3 download when that suits the destination.
The recorder captures mono microphone audio, with up to ten minutes of active recording and a sixty-minute elapsed session limit. It needs microphone permission on a secure page. Keep the page visible, check its status after interruptions and save promptly; temporary local storage is not a permanent backup.
If loud passages remain distorted after correcting input level, compare another microphone or capture path with the same test. A different fault can sound harsh too. This page does not provide a de-clipping tool, a limiter, noise removal or a guarantee that conversion fixes distortion. Choose a hardware or recording workflow that can handle the performance before committing to another full take.
Common questions
Does turning down the finished recording fix clipping?
It lowers the level but does not reconstruct the original peaks removed by clipping. In our model, the turned-down clipped file and clean file both peak at about −6.02 dBFS, yet one retains flat tops. Correct the input and record again when possible.
What recording level should I use for a loud voice?
Use your loudest planned phrase to choose input gain. An external peak meter with margin below 0 dBFS helps; around −6 dBFS is a starting point in Audacity’s guidance, not a universal guarantee. Leave more margin for unpredictable peaks and verify the actual recording.
Does a full Input level bar mean my recording clipped?
Not by itself. Voice Recorder’s bar displays RMS with a capped visual range, rather than calibrated peak dBFS. Brief overload can also escape an average-level display. Preview the test and inspect the downloaded WAV with a suitable meter or sample-level editor when necessary.
Were these examples recorded with a real microphone?
No. They are original synthetic 220 Hz tone bursts generated mathematically, exported as WAV and measured by a sample scan. The waveform demonstrates digital headroom and hard clipping. It does not establish a microphone setting, voice quality result or device-specific recording performance.