Published by PitchChanger · Updated · How these guides are made
Hear the difference
Compare the same quiet/loud fixture through four controlled settings. Keep player volume fixed to hear the level changes; use the measured RMS table to compare the gap.
Pause your workspace preview before comparing these clips.
Original synthesized tone, not a vocal or song mastering test. All WAV exports are eight seconds at 48 kHz. No EQ boost, saturation or peak protection confounds these comparisons; the fixed high-pass remains active.
How to use this workflow
Create a controlled baseline
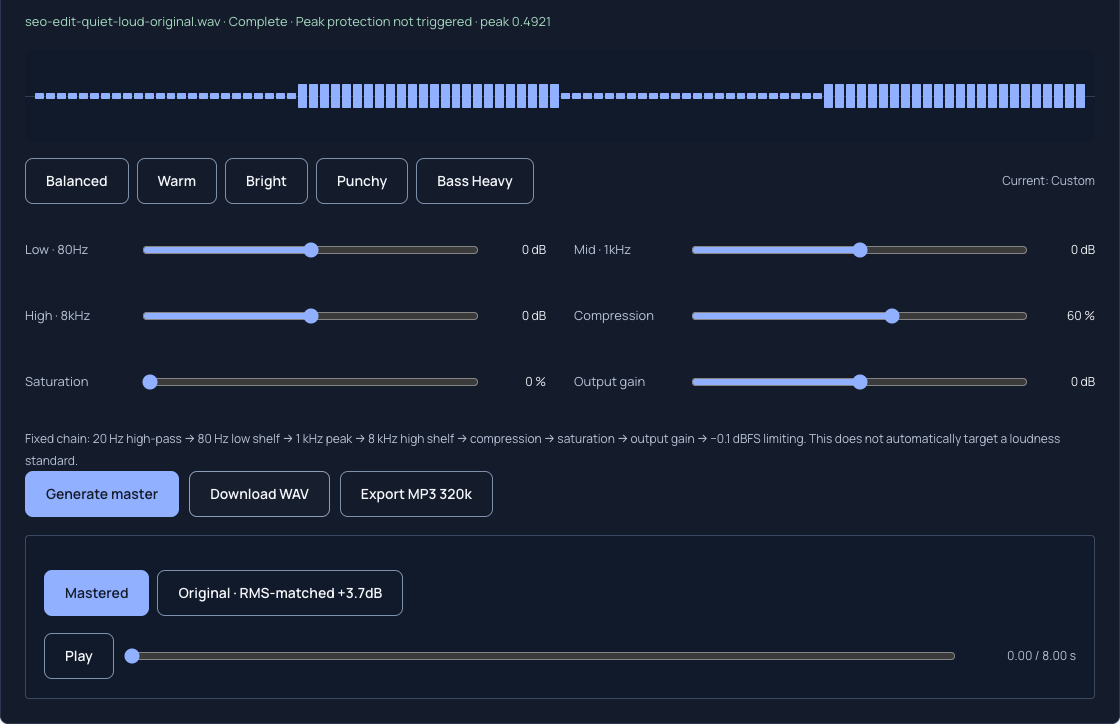
Open Online Mastering and import the original quiet/loud fixture below. Set all three EQ controls to 0 dB, Compression to 0%, Saturation to 0% and Output gain to 0 dB. Press Generate master and download the baseline WAV. The fixed 20 Hz high-pass remains active.
Test a level change alone
Leave Compression at 0% and change Output gain to +6 dB. Generate and save a new result. This isolates the level control; the supplied fixture leaves enough headroom that peak protection does not trigger.
Test compression without changing output gain
Set Compression to 60% and Output gain back to 0 dB, keeping EQ and Saturation unchanged. Generate the result again. Compare a quiet passage and a loud passage, not just the overall volume.
Set delivery level after judging the dynamics
If the dynamic relationship is useful, adjust Output gain and render again. Use the Original and Mastered preview choices for a level-conscious comparison, then listen to the downloaded file in your destination player. Watch for the peak-protection message.
Output gain vs compression: match the control to the problem
Output gain applies the same amplitude multiplier across the processed signal before the final sample ceiling. Compression responds to signal level over time. It can reduce the contrast between louder and quieter passages even when the overall result also becomes louder.
MDN describes the Web Audio compressor as a dynamics effect and gain as multiplication of sample values. The settings and measured table below describe this particular tool, rather than promising identical behavior from every compressor.
Swipe or scroll sideways to read all columns.
| Problem you hear | Start with | Check afterward |
|---|---|---|
| The whole result needs to be louder or quieter | Output gain | Peak protection and destination playback |
| Loud moments stand too far above quieter ones | Compression | The quiet/loud gap, attacks and release behavior |
| The tone balance is wrong | EQ, then reassess dynamics | Do not compare several changed controls at once |
| A recording already contains unwanted distortion | Inspect the original source | This workflow has no de-clipping control |
Measured quiet and loud passages, with settings held constant
The original fixture is an eight-second synthesized 440 Hz tone alternating two-second quiet and loud passages. Their source amplitudes are 0.08 and 0.32. We measured quiet RMS from 0.5–1.5 seconds and loud RMS from 2.5–3.5 seconds to avoid the short boundary fades.
Every result was exported through the real tool as a 48 kHz, mono, 16-bit WAV with 384,000 frames. EQ stayed at 0 dB and Saturation at 0%; the fixed high-pass stayed in the chain. Peak protection did not trigger in any of these four exports.
Swipe or scroll sideways to read all columns.
| Compression / gain | Quiet RMS | Loud RMS | Loud–quiet gap |
|---|---|---|---|
| 0% / 0 dB | 0.05663 | 0.22654 | 12.04 dB |
| 0% / +6 dB | 0.11300 | 0.45201 | 12.04 dB |
| 60% / 0 dB | 0.12964 | 0.33339 | 8.20 dB |
| 60% / +6 dB | 0.25867 | 0.66520 | 8.20 dB |
Read the level gap separately from overall loudness
Adding +6 dB with Compression at 0% increased both measured windows by approximately 6.00 dB. Their difference stayed at 12.04 dB. At 60% Compression and 0 dB output gain, the gap narrowed to 8.20 dB. Adding +6 dB after that left the narrower gap at 8.20 dB.
The compressed fixture’s RMS levels were also higher than the uncompressed baseline in this Chromium run. Compression therefore did not simply turn the whole example down. A louder preview alone cannot show whether the dynamic change helped, and these values are not LUFS or a listening-quality rating.
A gain calculation worksheet before the ceiling is reached
For a gain change G in decibels, the calculated amplitude multiplier is 10^(G/20). A +6 dB change is approximately 1.995 times amplitude, not exactly twice. Multiplying a hypothetical 0.32 sample peak by that factor predicts about 0.6385 before any other processing.
That calculation is a gain-only expectation. The actual +6 dB baseline export peaked at 0.63959; the fixed high-pass also remained in this processing chain. Use the exported sample peak when checking this chain rather than treating the simple calculation as a measured result.
Swipe or scroll sideways to read all columns.
| Calculated gain change | Amplitude multiplier | 0.32 × multiplier |
|---|---|---|
| −6 dB | 0.5012 | 0.1604 |
| 0 dB | 1.0000 | 0.3200 |
| +3 dB | 1.4125 | 0.4520 |
| +6 dB | 1.9953 | 0.6385 |
Compare the preview fairly and verify the download
The Original preview choice automatically adjusts the original by an RMS-based gain derived from up to the first 30 seconds, capped at ±12 dB. There is no separate matching switch. That preview adjustment does not rewrite the original source or normalize the downloaded master.
Compression has a single 0–100% control. It is not a percentage reduction in every sample, and there are no separate attack, release, threshold or ratio controls. Output gain ranges from −12 to +12 dB. The final protection applies a −0.1 dBFS sample ceiling; it does not certify true peak or target a LUFS standard.
Listen to the attack, sustained portion and return to quiet material at a comparable playback level. If more gain triggers protection, lower it and render again before deciding whether compression is needed. WAV and MP3 exports are available; save the WAV when you want an editing intermediate.
Common questions
Can output gain make a loud and quiet passage more even?
A constant gain change alone preserves their amplitude ratio while neither is limited. In the measured fixture, +6 dB raises both windows by about 6 dB and leaves their 12.04 dB difference unchanged. Compression can alter that relationship; the 60% example reduces the difference to 8.20 dB.
Does 60% Compression mean the signal is 60% quieter?
No. It is an amount setting that controls the compressor’s internal behavior, not a fixed multiplier for every sample. The result depends on the source and time history. Here it narrowed the loud–quiet gap while also raising the measured RMS levels relative to the baseline.
Why did my downloaded result sound louder than Original in the preview?
The Original preview is RMS-matched automatically for comparison with the master. That matching affects the preview path only. The downloaded master keeps the actual processing and output gain you selected, so check it separately at a consistent player volume.
Does the peak-protection message prove a streaming loudness target was met?
No. The protection concerns the exported signal’s sample ceiling. This tool does not provide LUFS targeting or true-peak certification. Use the meters and requirements of the actual delivery workflow if you need to establish a particular loudness or true-peak specification.